The Social Media Team Starter Guide Part 5 – Tracking and Reporting


Thinking about Tracking is a bit of a chicken and the egg situation, because in order to have goals to track, you need to be putting out work. But, in order to know what work you should be putting out there, you need to know which goals you’re working towards.
The reason that I’ve chosen to put tracking and analytics here, at the end of the Starter Guide, is because the rest of the strategy, setup, people, and resources must be in place before we put an analytics plan in place, but it also must happen before we turn the key on our strategy and start moving.
This is the final piece of our 5-part Social Media Starter Guide. To jump to a different part, just click one of the links below:
Step 1: Figuring out what to track
The first step in tracking, and the key to producing reports that actually matter, is not in the data at all. It’s actually about taking a look at the business objectively and asking yourself: What does real success look like, and how can social/digital affect that progress?
Oftentimes the best person to ask that question to will be the CEO, or the VP of Marketing, and of course if you’re all of those things rolled into one, then it’s on you.
Some potential answers that you could come up with might look like: Make a new audience aware of our brand, or: drive new trials of our product, or it’s straight-up: Increase top line sales.
If you’ve been following along with this guide you’ll notice that this looks an awful lot like Step 2 of Part 1: The Essentials. Step 2 is about setting goals, and this part is about measuring your progress (or regression) towards those goals.
Here are a few ways that goals can turn into trackable metrics:
-
- Goal: Become a useful resource to our community, providing answers and inspiration that make our sales team’s process easier. Metric: Number of new leads collected from landing pages this year.
OR
-
- Inspire customers to use our products in new and different ways by entertaining them with a combination of photo and video content. Metric: A combination of community growth, on-content engagement, and website traffic from social media sources.
OR
-
- Drive new trials of our product by identifying an active community, providing value to it and clearly communicating how our product is useful to them. Metric: Number of new signups on our product page.
OR
- Extend what the brand is doing in the offline world to the online world. Make people feel cared for and a part of the brand, ultimately creating a self-sustaining community that is aligned with what we believe in. Metric: Number of brand stories shared (across all channels) by our community.
Step 2: How to track them
Once you’ve defined those numbers, the rest of the work is easy. There are a ton of reporting dashboards out there, but especially for reporting inside of your organization, my favourite is a good old fashioned Google Sheet, Google Analytics, and the analytics section of your social media channel of choice.
You see, if you worked Step 1, then what you’re left with is a handful of numbers that will clearly and meaningfully let you know how you’re doing. And they’ll make your life easier because the bosses/investors won’t have to slog through CTR/CPC/ROAS jargon to figure out whether their social/digital team is making progress. The Google Sheet will be a simple set of rows that show this week’s numbers vs previous weeks, months and quarters. Your job is just to get good at digging through the free data that the platforms give you, and slot it into the right rows.
Here’s a link to a sheet that Buffer put together that may be useful to get started.
Here’s the best place to get really good at Google Analytics.
And where to learn about Facebook Insights.
Spoiler: Both links take you to the Platforms’ own training resources, which happen to be both outstanding and free.
Beyond the high level numbers, there are a ton of tools out there that can make your life easier by digging in and displaying data that you have access to for free, but will save you a ton of time that would otherwise be spent pulling it together.
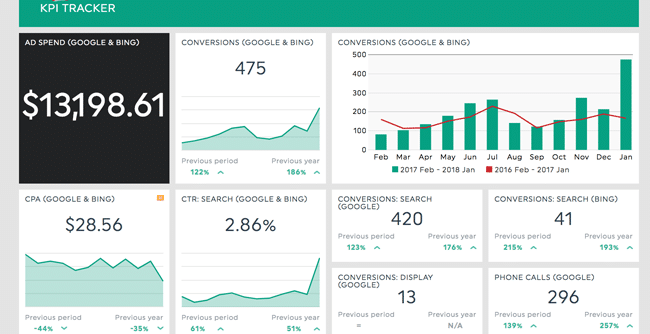
My personal favourite is DashThis for the way that it easily integrates into your platforms and visualizes the data in such an easy to read way (bonus points: they’re Canadian). It goes for about $150/month:
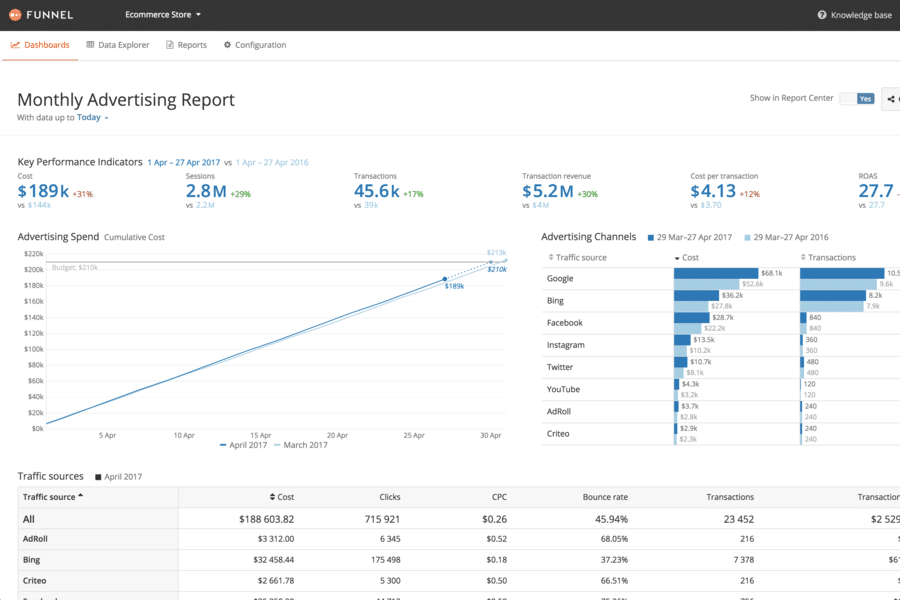
Then you’ve got Funnel.io, which is a bit more robust in terms of how it tries to break out your data by objective and tie different interactions to conversion. I find it a bit clunky, and prefer to do those attributions myself, but lots of people do find it helpful. Plans start at $250/mo:
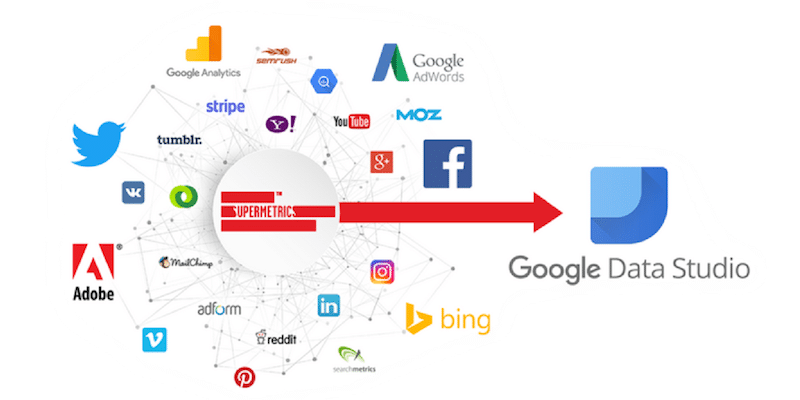
And Supermetrics is an awesome tool if you have a bit more data-skill. Basically, it plugs into Google Sheets or Google Data Studio and allows you to integrate the widest variety of platforms however you want. With great flexibility comes great responsibility, and the up-front legwork is a bit greater, but the cost vs. possibilities is by far the best if you’re willing to learn. The data Studio cost is about $25/mo, and the Google Sheets cost start at $80/mo:
There are lots more good ones out there. Here’s a quick cheat sheet:
Cheap & Simple
Less-cheap & more robust
Step 3: Making it a practice
Just like everything else in this guide, it is only useful if you turn the tactic into a repeatable, sustainable behaviour that builds on itself over time. In order to do that, regardless of the metrics and software that you’ve chosen, the process looks pretty much the same:
Weekly:
Check your key metrics’ progress. What happened this week, what could have caused the progress or regress, and how do those numbers compare to your overall trend? It will take you a bit of effort in the first few weeks to answer those questions, but as you get more comfortable with the practice, it will become second nature, and numbers will start to pop out at you.
Monthly:
Prepare a high level report, complete with takeaways and lessons. Force yourself to be objective and look into the actual reasons that things did or didn’t happen. It’s human nature to make excuses for shortcomings and over-credit when the numbers are good. Very often both directions are unrelated to what we did, and it could be that our work helped a bad month be better than it could have, or a great month covered up our mistakes. Being truly objective and honest with yourself is a challenge, but without it, all of the reporting in the world is meaningless.
Quarterly:
Here’s where we give ourselves the gift of time and distance. Some managers who I’ve worked with will take a full day out of the office to review what’s happened each quarter. Others bring in people like us to be their third party perspective and review everything that’s happened. In these cases, I always like to remind people that whatever comes from your quarterly review doesn’t change where you are. You know the financial results, you know your social, ad spend, and traffic numbers. Good, bad, or otherwise, the Quarterly review will give you the best possible chance to learn and grow for the following period.
And that’s it.
This 5-part series is something that I put a lot of time, thought, effort, and research into and it’s the results of thousands of hours of work that we’ve done with our clients.
Even so, it’s just the tip of the iceberg in terms of what you can do to set up your team for success, and the work that we deliver for our clients. If you found this to be useful, I’d love it if you passed it on to another manager who you know could benefit from its lessons, and I hope that you also sign up for our email where I send out stuff like this, as well as the latest news, every Monday.
Thanks so much for reading. If there’s anything that I can do to help, clarify, or if you disagree with anything that you’ve read I’d love to hear from you. My email address is conner@wearejunction.com and we can be found on Twitter at @heyjunction.
—-
If this guide is useful to you, then I’d love to have you on the Social Brief list so that you get the rest. Every Monday I send a piece like this out to our community. To be included, just enter your work email address in the box below.
You may also like: